Simulating an nMOSFET with Synopsys TCAD
As part of the Technologies and Electronic Devices exam at university, I worked (together with a fellow student) on a semiconductor simulation project using Synopsys TCAD (Technology Computer-Aided Design), a suite that simulates both the fabrication process of a semiconductor device (sprocess) and its electrical behavior (sdevice). The goal was to build a complete nMOSFET from a bare silicon wafer, and then tweak the geometry and the physical parameters of the process to verify, quantitatively, that the simulated device behaves as the theory says it should.
Growing the gate oxide
The first part of the project was a study of thermal oxidation, the process step that grows the thin layer of SiO₂ insulating the gate from the channel. We simulated dry (O₂) and wet (H₂O vapor) oxidation on silicon wafers with different crystallographic orientations, varying time and temperature:
| Orientation | Type | Time (min) | Temperature (°C) | Oxide thickness (nm) |
|---|---|---|---|---|
| 100 | DRY | 20 | 900 | 8.9 |
| 110 | DRY | 20 | 900 | 12.2 |
| 111 | DRY | 20 | 900 | 12.2 |
| 110 | DRY | 12 | 900 | 9.0 |
| 111 | DRY | 12 | 900 | 8.75 |
| 100 | WET | 20 | 900 | 59.9 |
| 110 | WET | 20 | 900 | 77.7 |
| 111 | WET | 20 | 900 | 87.8 |
| 100 | WET | 2 | 900 | 10.6 |
| 111 | WET | 2 | 900 | 15.1 |
| 111 | WET | 5 | 810 | 9.8 |
The results match the theory nicely: orientations with a higher surface atom density (111, 110) expose more atoms to the oxidizing agent and grow oxide faster than 100, and wet oxidation is almost an order of magnitude faster than dry; too fast, in fact, for a well-controlled ~9 nm gate oxide, although useful for thicker protection/isolation layers. The engineering angle of the exercise was finding cheaper recipes for the same ~9 nm target: a 12-minute dry oxidation on a 111 wafer matches what a 100 wafer needs 20 minutes for, and a wet oxidation at just 810 °C for 5 minutes gets there too, with a considerable energy saving (still a theoretical result, such a short wet step would probably be hard to control in a real fab).
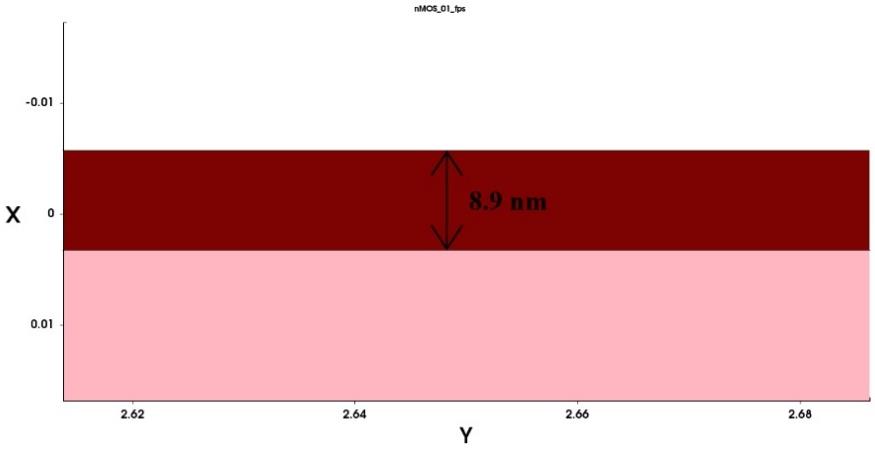 Dry oxidation of a 100 wafer (20 min, 900 °C) grows a thin, gate-quality oxide of about 8.9 nm.
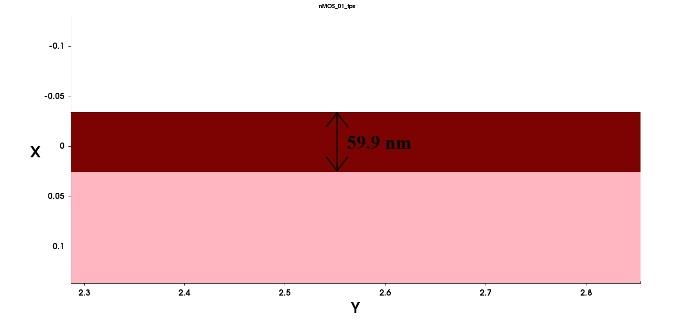 Wet oxidation under the same time and temperature grows almost an order of magnitude more oxide (~59.9 nm); too thick for a gate, but useful as a protective/isolation layer.
Fabricating the (virtual) device
The reference device is an nMOSFET with a 700 nm channel, built step by step in sprocess like in a real fab. The full recipe: p-type substrate (Boron, 10¹⁵ cm⁻³, orientation 100); dry gate oxidation (900 °C, 20 min); deposition of 200 nm of heavily n-doped polysilicon (Phosphorus, 10¹⁹ cm⁻³); photolithography and etching to define the gate; nitride spacers; a second lithography to open the source/drain windows; ion implantation of Arsenic (dose 5·10¹³ cm⁻², energy 65 keV); annealing at 850 °C; oxide deposition, contact hole etching and aluminum metallization. In the simulator this looks like a short script of self-explanatory commands, for example the implant step:
# Source-Drain region Implant (N+)
implant Arsenic dose=5e13<cm-2> energy=65<keV> tilt=7 rotation=0
strip photoresist

# Annealing
diffuse temperature=850<C> time=15<min>
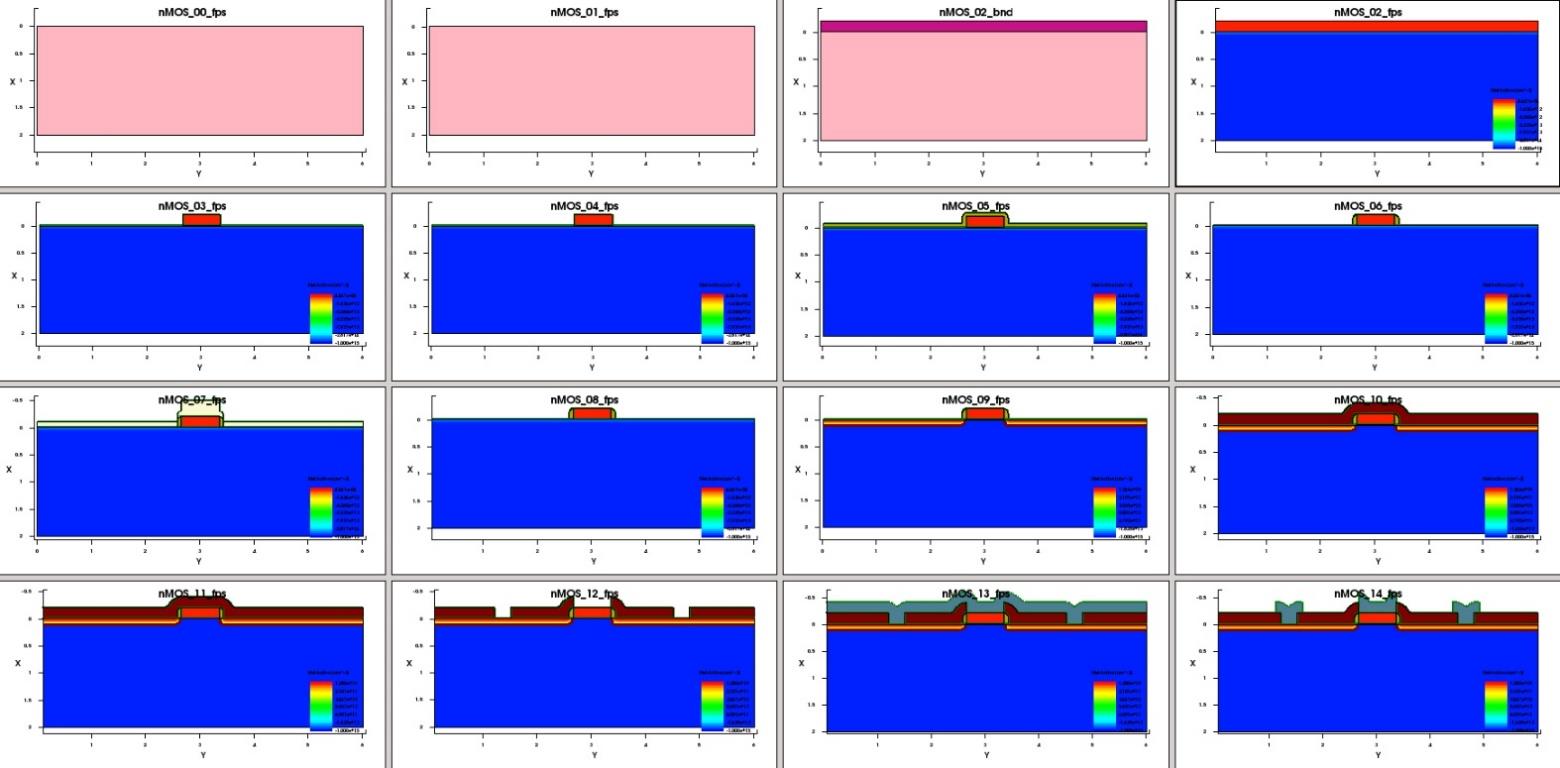 The full
sprocess flow, step by step: from the bare p-type wafer to the finished, metallized nMOSFET.
The finished structure is then handed to sdevice, which solves the semiconductor equations on the mesh and produces the electrical picture of the device: electron and hole densities, doping profile, depletion regions, electrostatic potential, and the output characteristics (drain current vs Vds for several gate voltages).
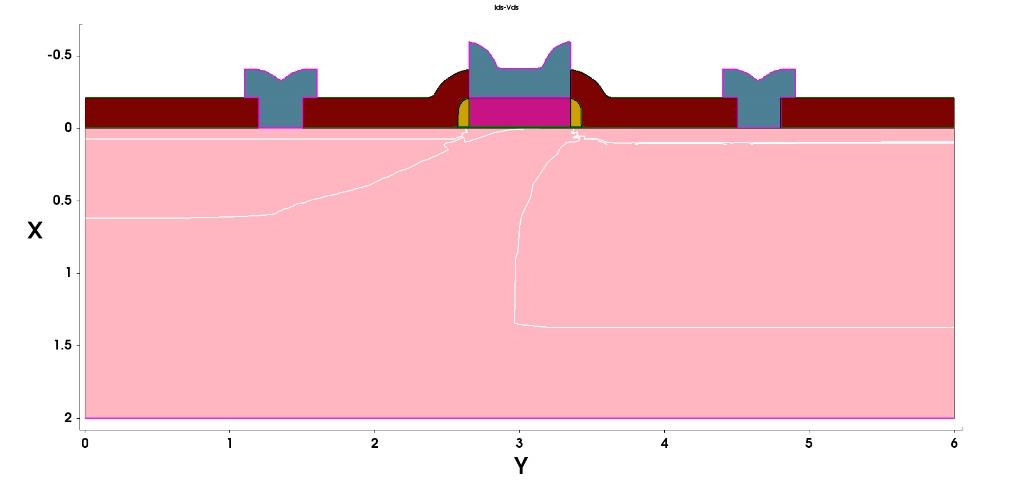 Doping map of the finished device: the heavily doped n⁺ source and drain (red) flank the gate, over the lightly doped p-type substrate (blue).
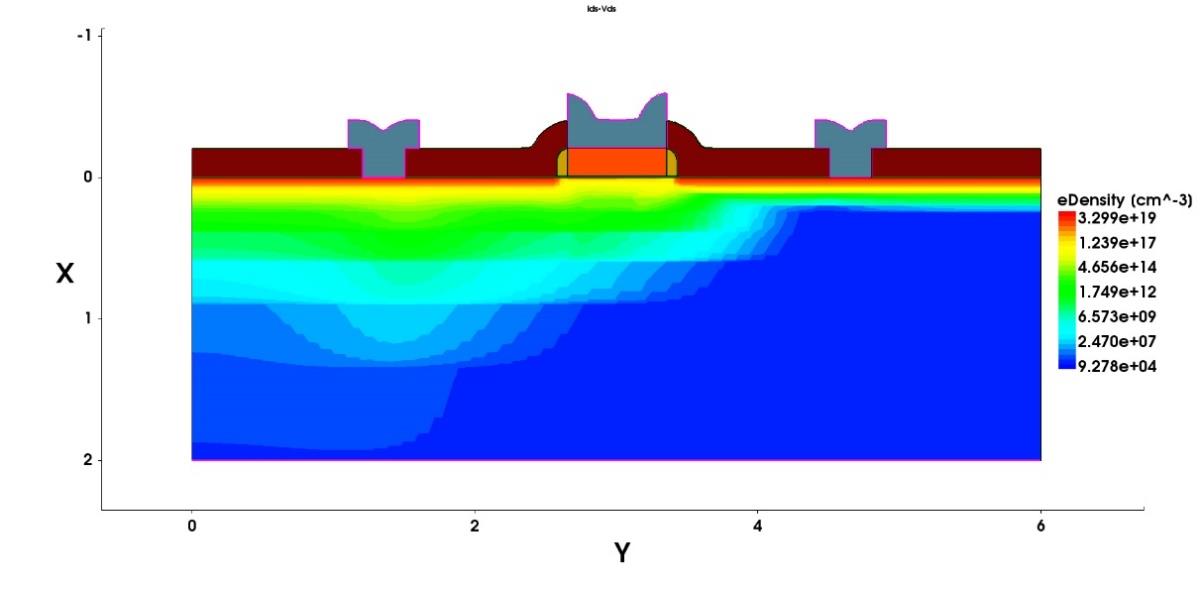 Electron density: carriers pile up just under the gate oxide, where the conducting channel forms.
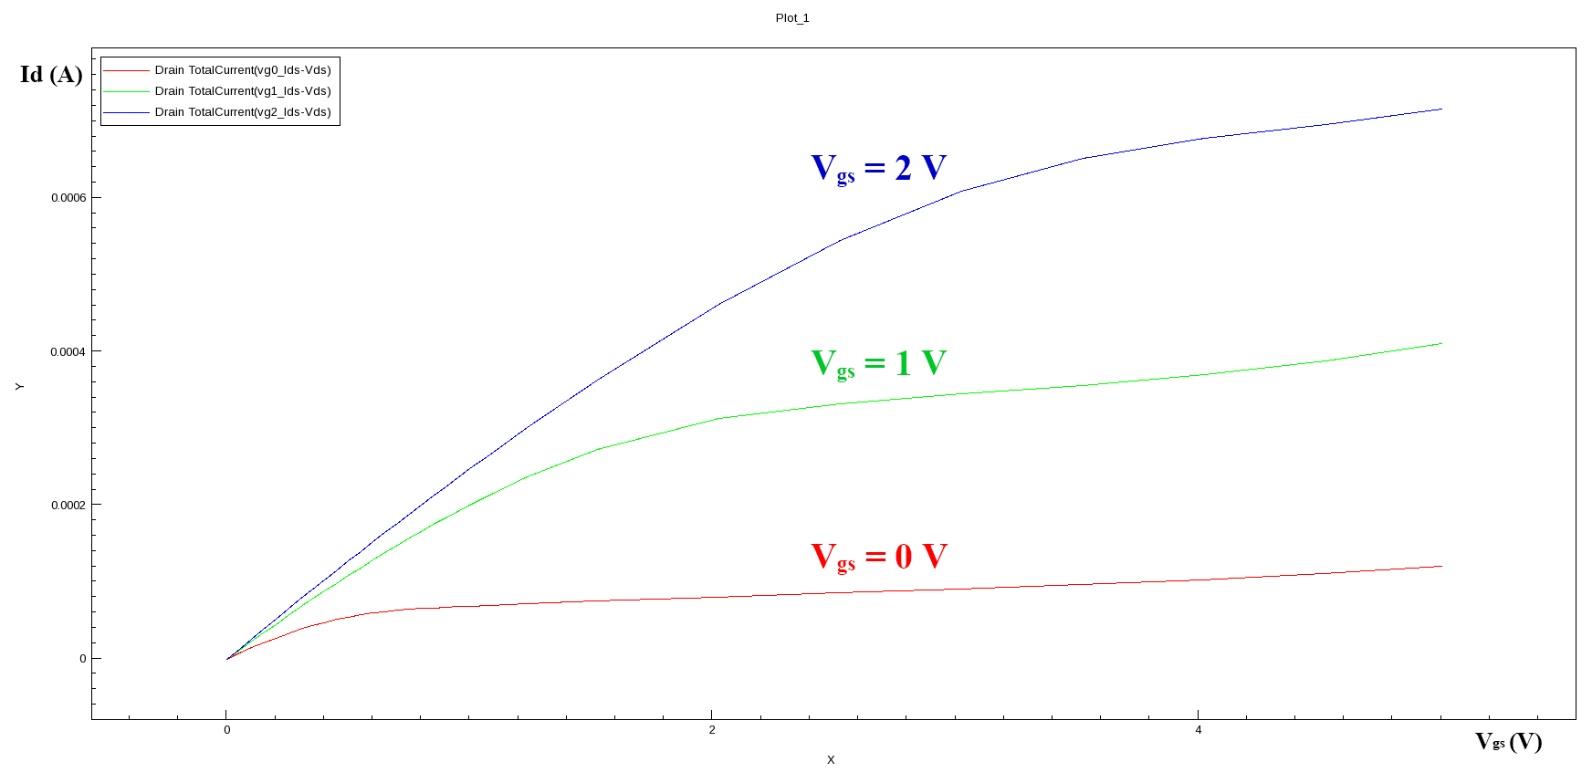 Output characteristics of the reference device, drain current vs Vds for Vgs = 0, 1 and 2 V.
What the experiments showed
Two parameter studies followed, both confirming textbook behavior:
- Channel length. The same process was repeated with the channel stretched from 700 nm to 1700 nm. Under identical bias, the long-channel device delivers visibly less drain current in both the linear and the saturation region, exactly what the ID equations predict, since the current scales with W/L. A single geometric parameter, nothing else changed, and the output characteristics shift substantially.
- Implant tilt/twist. Implanting ions perfectly perpendicular to a mono-crystalline wafer causes channeling: ions slip deep between the regular planes of the lattice instead of stopping where intended. Tilting and rotating the wafer is the classic (and cheap) countermeasure. Comparing a process with tilt/twist = 0/0 against one with tilt/twist = 5.2°/17° (implant energy raised to 80 keV to make the effect more visible), the drain current at Vgs = 2 V, Vds = 5 V goes from 790 µA to 880 µA: an 11.4% gain from a parameter that costs essentially nothing to change.
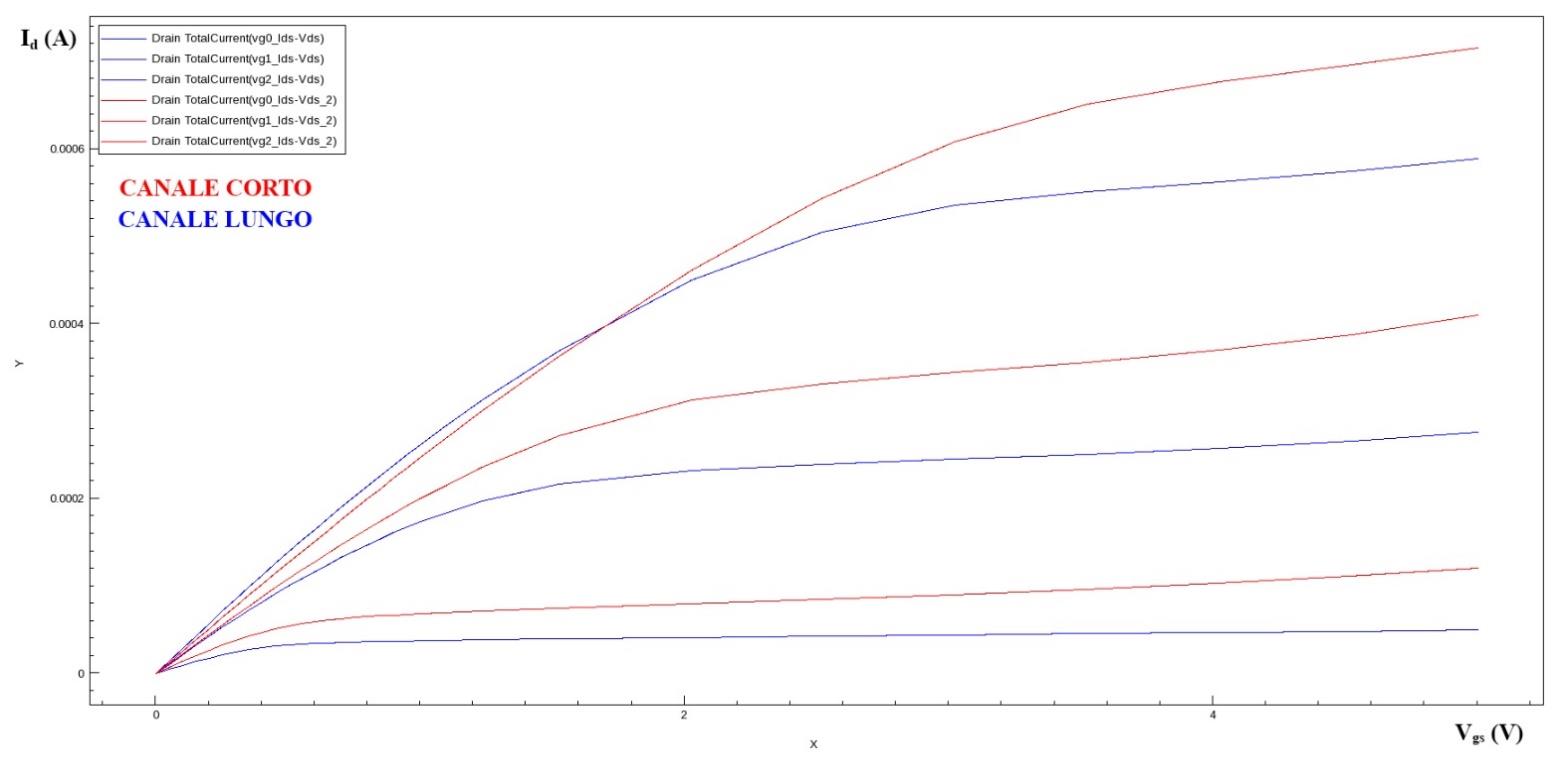 Same bias, two channel lengths: the 1700 nm device (blue) carries clearly less drain current than the 700 nm one (red), as W/L predicts.
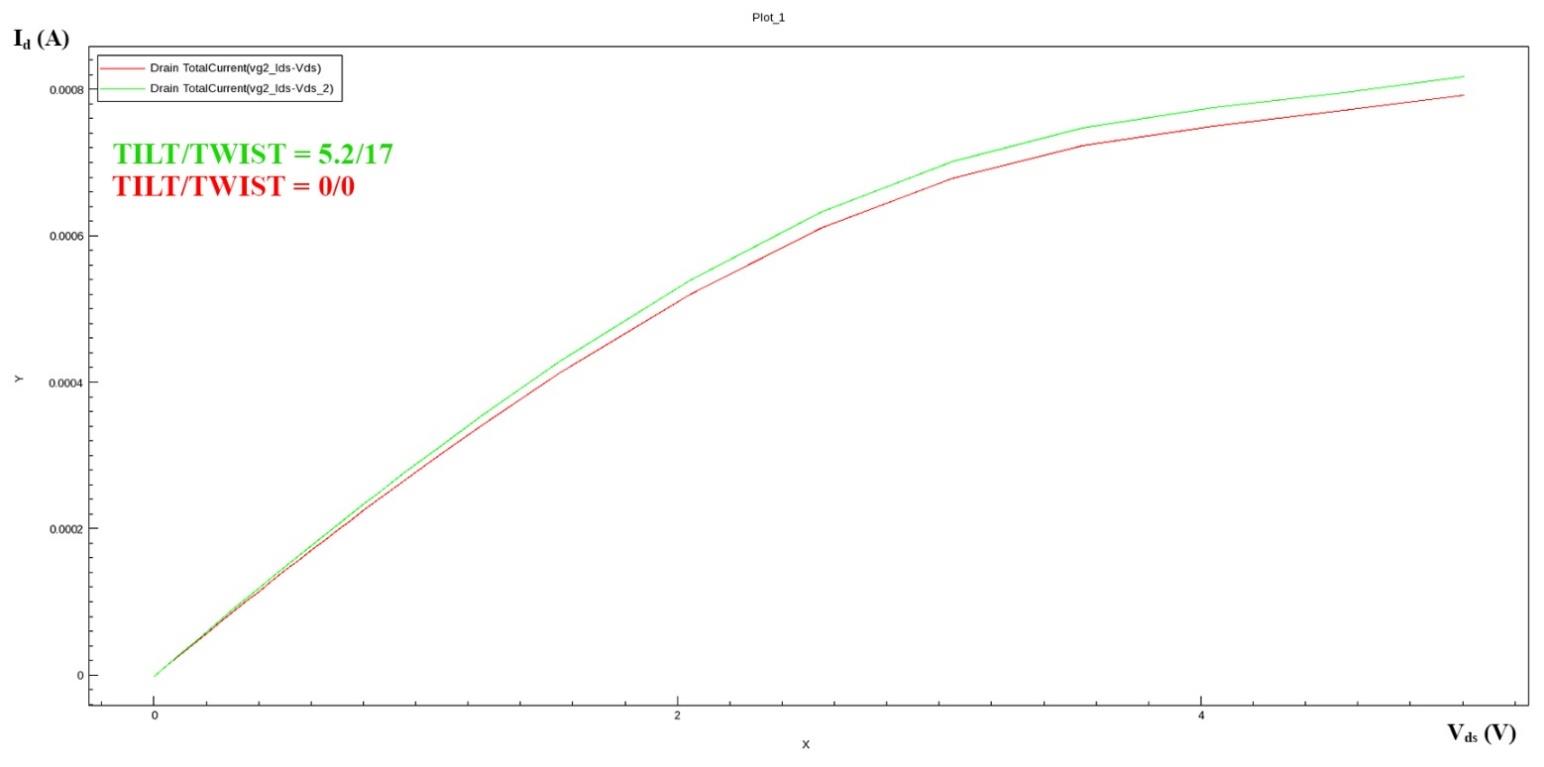 Tilting and rotating the implant (5.2°/17°, green) lifts the drain current above the perfectly aligned 0/0 case (red) by about 11%.
It was a satisfying project, the professor appreciated the effort. TCAD lets you “run a fab” from a laptop, and seeing doping profiles, depletion regions and I-V curves come out of a list of process steps; reacting to those steps exactly as the device physics equations predict makes the theory considerably more tangible.